What Is GIS Mapping?
GIS stands for geographic information system and the map is, of course, a visual representation of quantifiable data. Compared to traditional table maps, a GIS map is dynamic and interactive. It can reveal previously unseen features by highlighting them and show change of these features over time, based on the given attributes.
Cluster Maps
This type successfully combines the use of colors, shapes, and labels to cluster densely packed points of data together. In other words, there are too many points to be displayed individually on the GIS map, so they are fused into a single cluster point for convenience.
Bubble Maps
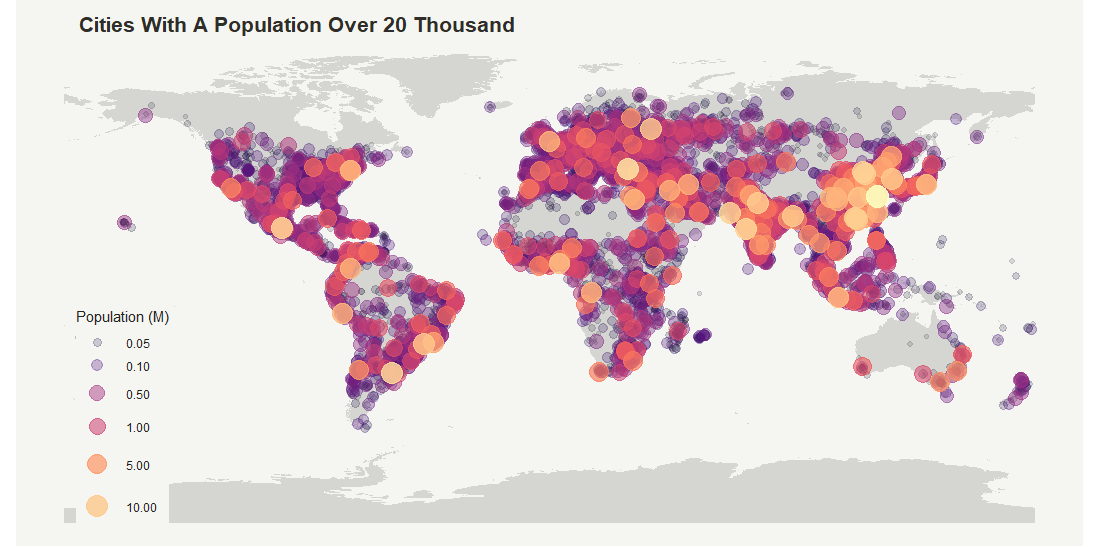
A bubble GIS map is an example of using shapes and the difference in their size to simplify the layout of complex numerical data. For example, imagine you need to compare the amount of people using certain slang words for different locations. Bigger and smaller bubbles on the GIS map will represent more and less people, respectively. Instead of boring rows and columns of numbers, you get bubbles. This provides a quick general understanding of the relationship between quantities and locations at a glance, saving time and effort.
